// CATEGORY
All Cloud & Streaming
Broadcast-grade streaming and cloud infrastructure that never blinks under load.
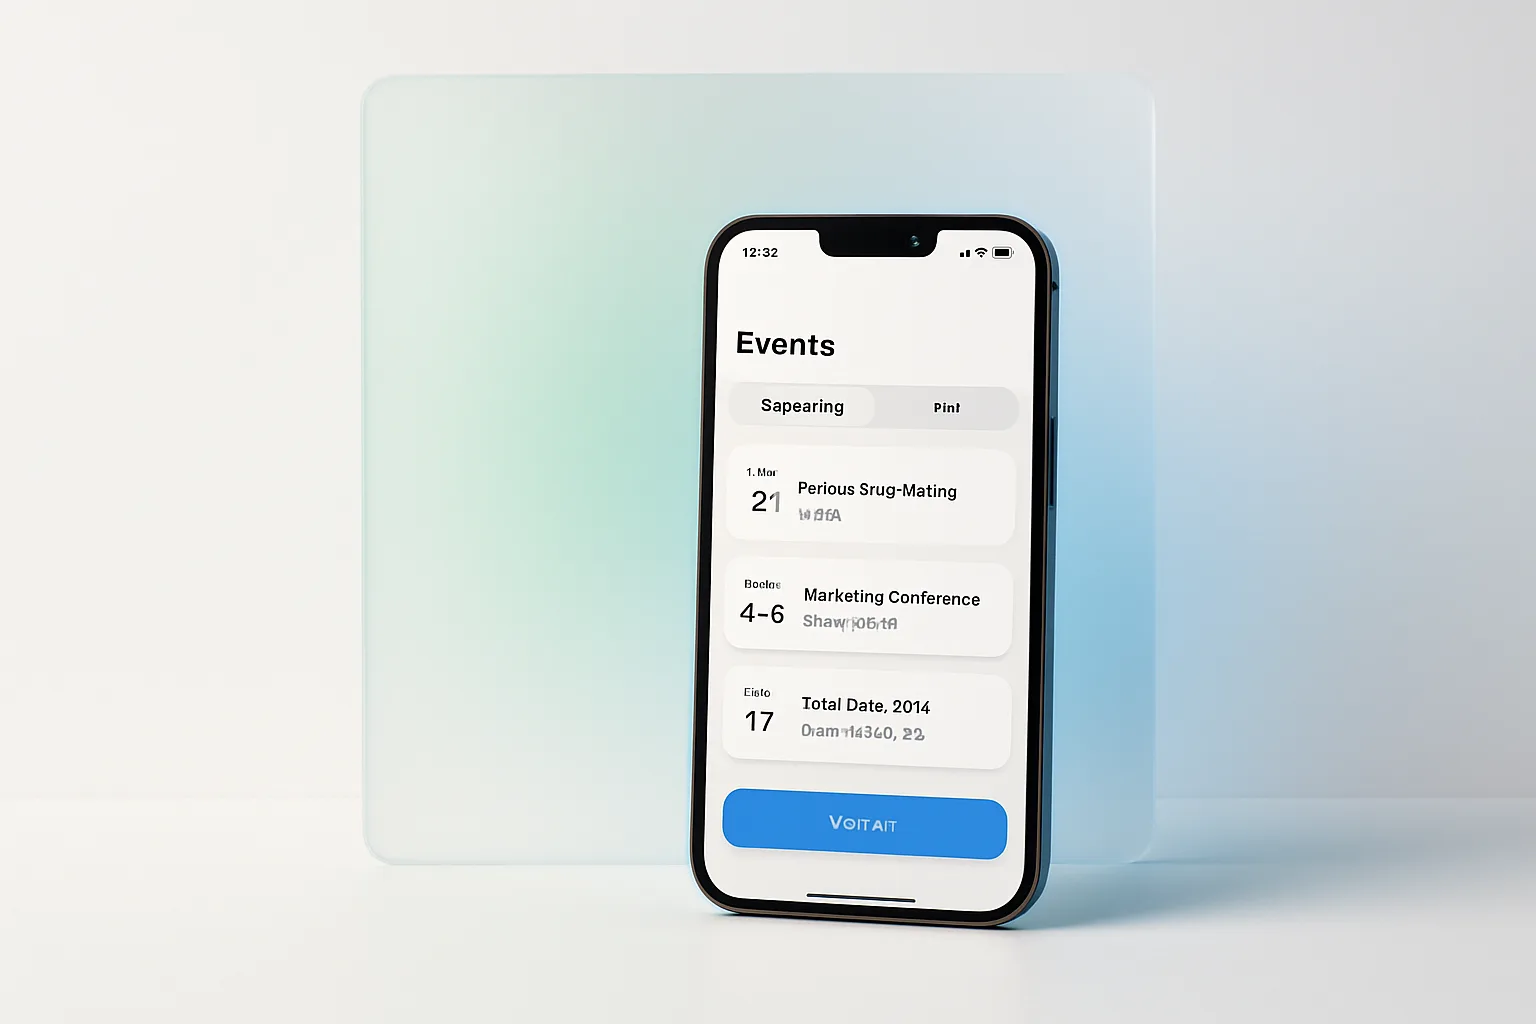
ExploreLive dashboards and audience intelligence that turn event data — check-ins, streams, app activity — into decisions you can make while it still matters.

Live dashboards and audience intelligence that turn event data — check-ins, streams, app activity — into decisions you can make while it still matters. Most event analytics arrive as a post-mortem: a PDF three weeks later telling you which session was empty. Real-time analytics change decisions during the event itself — live visibility into check-in flow, session occupancy, stream concurrency, app engagement, and sponsor interaction, updating in seconds.
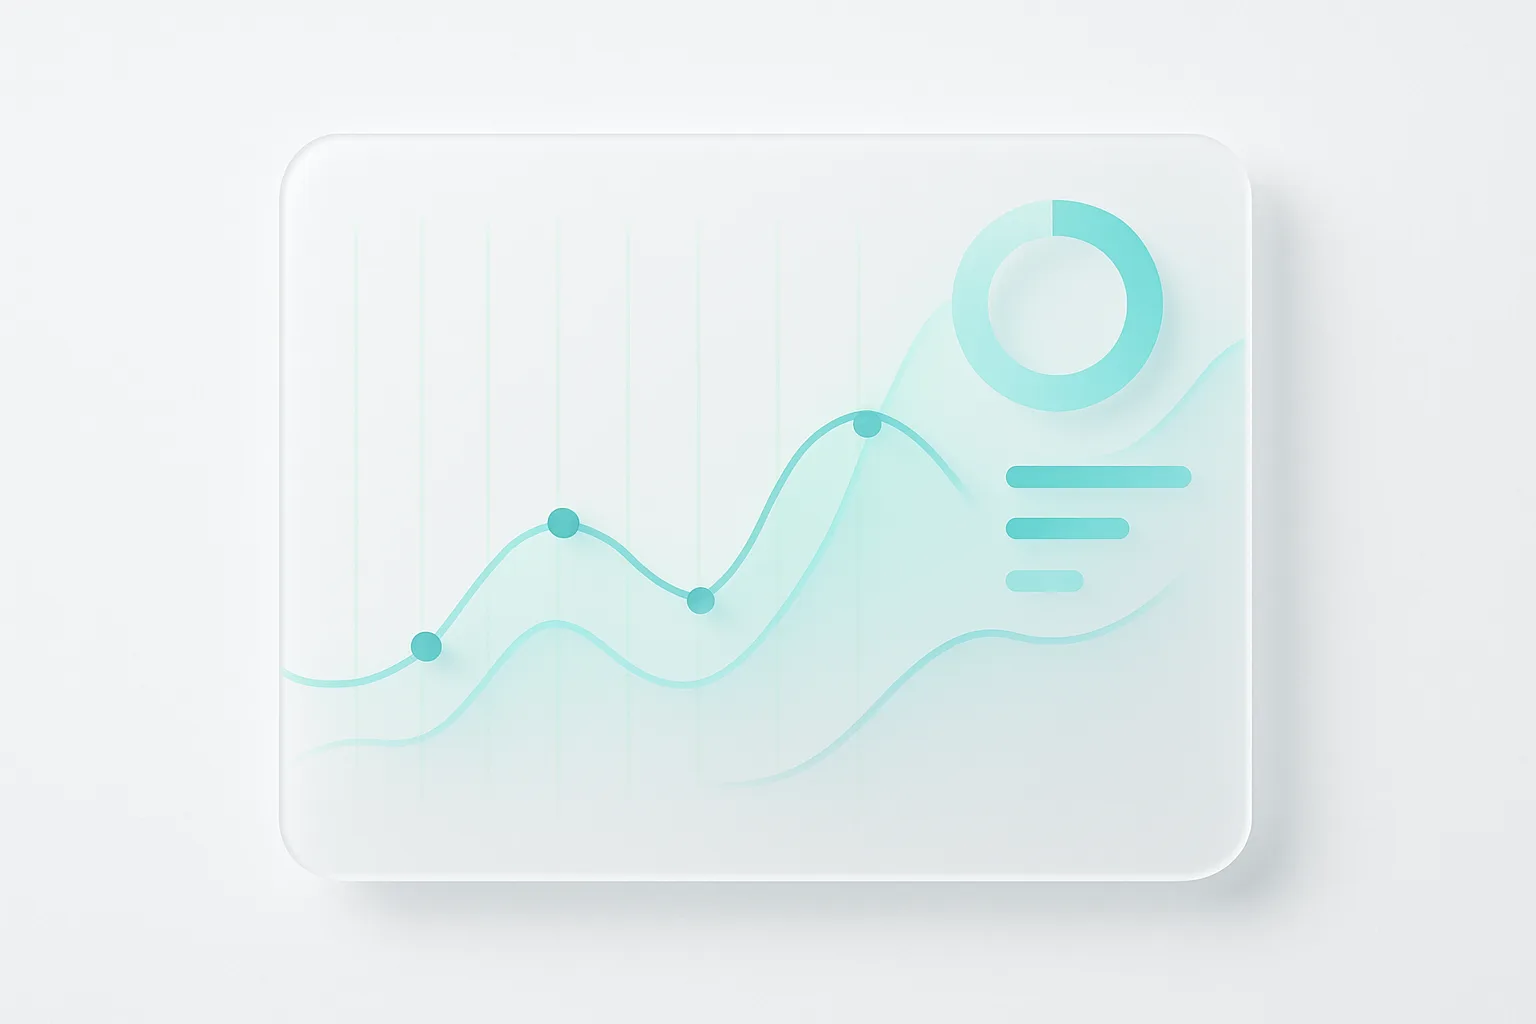
The engineering underneath is a streaming data pipeline: events from registration scanners, mobile apps, video players, Wi-Fi access points, and IoT sensors flow through ingestion and processing layers into live dashboards and alerting.
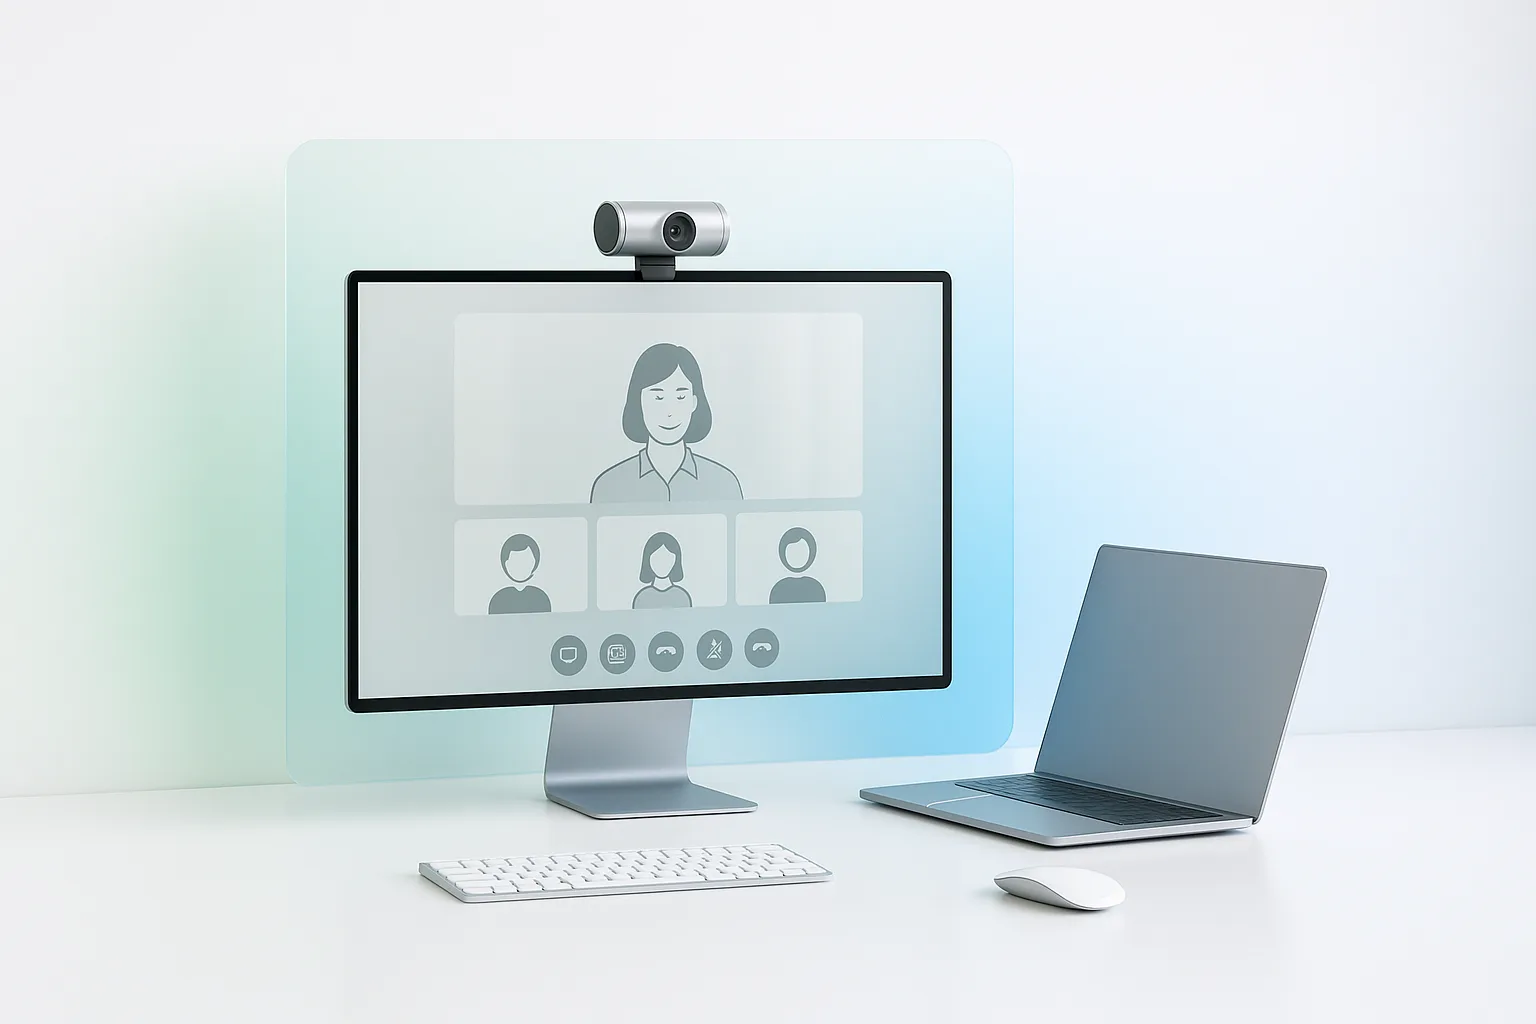
Organisers see queues building at Hall B before they become complaints. Producers watch remote viewers dropping off mid-keynote and act. Sponsors track booth traffic responding to a push notification in real time.
Check-ins, session occupancy, queue indicators, and stream concurrency visualised in real time for the show-control room.
Registration, app, video, Wi-Fi, and sensor data ingested into a single streaming model — no more reconciling five vendor reports.
Automatic notifications when metrics cross limits — occupancy nearing capacity, stream errors spiking, a hall underfilling.
Booth traffic, lead capture, brand impressions, and content engagement packaged as evidence sponsors can take to their boards.
Path analysis across sessions, zones, and digital touchpoints revealing what your audience actually values.
Consent-aware collection, aggregation by default, and DPDP/GDPR-aligned handling of personal data.
After the event, the same pipeline powers deep analysis: attendee journey analysis, content performance ranking, sponsor ROI reports with engagement evidence, and year-over-year cohort comparisons.
Because the data model is unified, every question — from "which sessions drove app sign-ups" to "what does our ideal attendee journey look like" — is answerable from one source of truth.
We define the decisions the data must support, then map every available source — scanners, apps, players, sensors — to those questions.
Streaming ingestion, data model, live dashboards, and alert rules built and tested against simulated event load.
Dry runs with your operations team to tune thresholds and confirm dashboards answer real show-floor questions.
On-event monitoring support, followed by deep-dive reports and a debrief that feeds next event's planning.

Real-time visibility transforms event operations from reactive damage control into proactive command and control. When data flows fast enough to change decisions while the event is live, analytics becomes operationally valuable rather than historically interesting.
Anything that emits events: registration and badge scanners, event apps, video player telemetry, Wi-Fi analytics, IoT sensors, social listening, and lead-capture devices. We build connectors where standard integrations do not exist.
Operationally instant: dashboard latency from a badge scan or player event is typically a few seconds end to end. That is fast enough for capacity, safety, and production decisions, which is what live analytics is for.
By design: collection follows the consent captured at registration, dashboards aggregate rather than expose individuals, personal identifiers are minimised in the pipeline, and retention is policy-bound. We align implementations with DPDP and GDPR from the architecture stage.
Yes. The streaming pipeline is built for high-concurrency ingestion across thousands of simultaneous events. We test implementations against projected load and tune partitioning and throughput before go-live.
Real-time analytics and audience insights powered by a unified data pipeline. Learn how ZebIQ builds analytics that matter during your event, not weeks after.
// CONTINUE EXPLORING
Up to the category, across to complementary services, and into the engine-room notes.